Logs
What can you do on the Bond Portal Logs page.
Overview
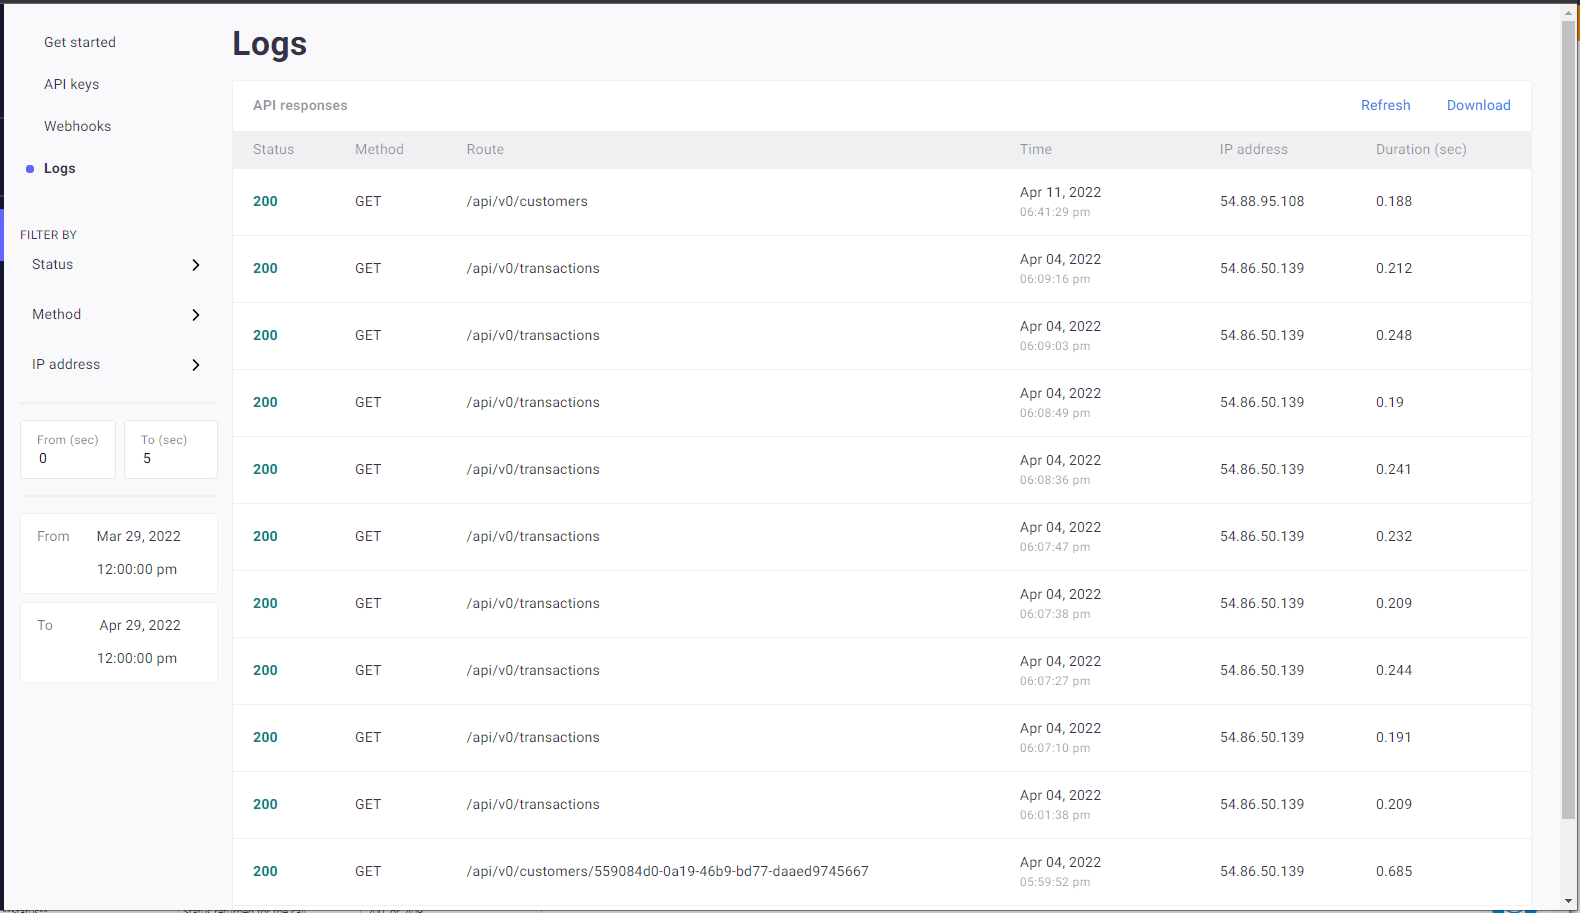
All API calls and many of their details are logged and these details can be filtered and expanded. The logs enable you to track activity, investigate issues, and view trends.
What can you do on the Logs page
On this page you can:
- View the history and details of all API calls made using your API keys.
- Examine log details for each call.

The following API call details are displayed.
| Item | Description | Example |
|---|---|---|
| Status | Status returned for the call. | 200 or 409 |
| Method | Method used for the call. | GET or POST |
| Route | Route used by the call. | /api/v0/customers/71b452bf-4cd7-4cd8-93e7-18668232fed2/verification-kyc |
| Time | Date and time the call was made. | 1/16/2022 10:53:21 AM |
| IP Address | IP address from which the call was made. | 54.86.50.134 |
| Duration | How long it took for the response to be made to the call, in seconds. | 1.16300 |
Filtering log entries
You can filter logs using the graphical interface.
Filtering logs using the graphical interface

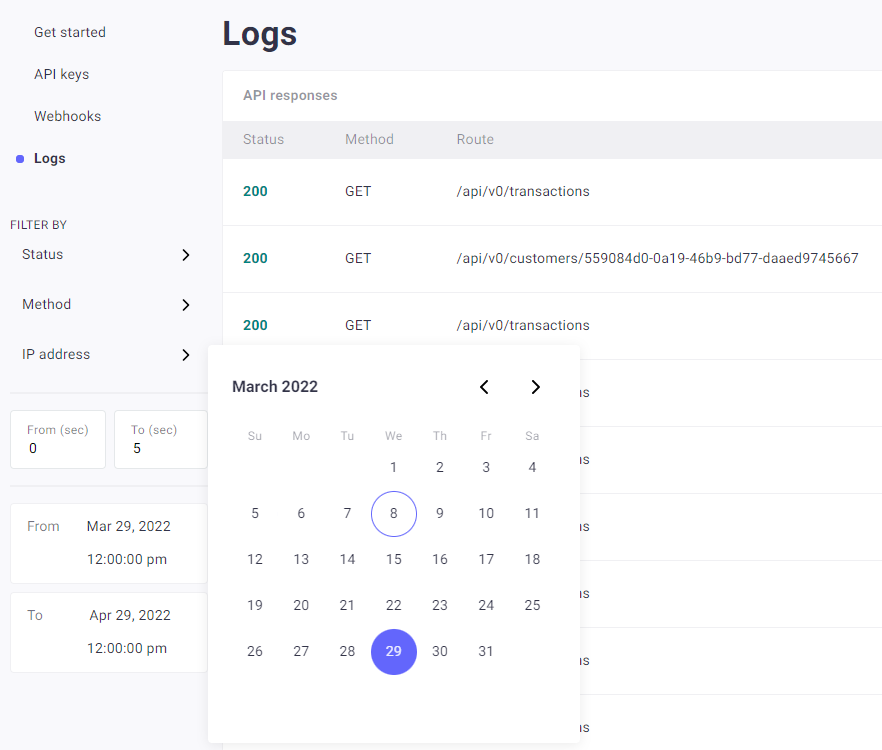
- Use one or more of the the following filters:
| Filter selection | Description |
|---|---|
| Date/Time | Using the From and To calendars, select the date/time range to display. |
| Status | Status of the API call response. Possible values:
|
| Method | Method used with the API call. Possible values:
|
| IP Address | IP address from which the API call was made. |
| Duration | Duration of the API call (in seconds). Range from 0 to upper limit. |
- Click Filter.
- To clear the filter, click X next to any active filters.
Displaying log details
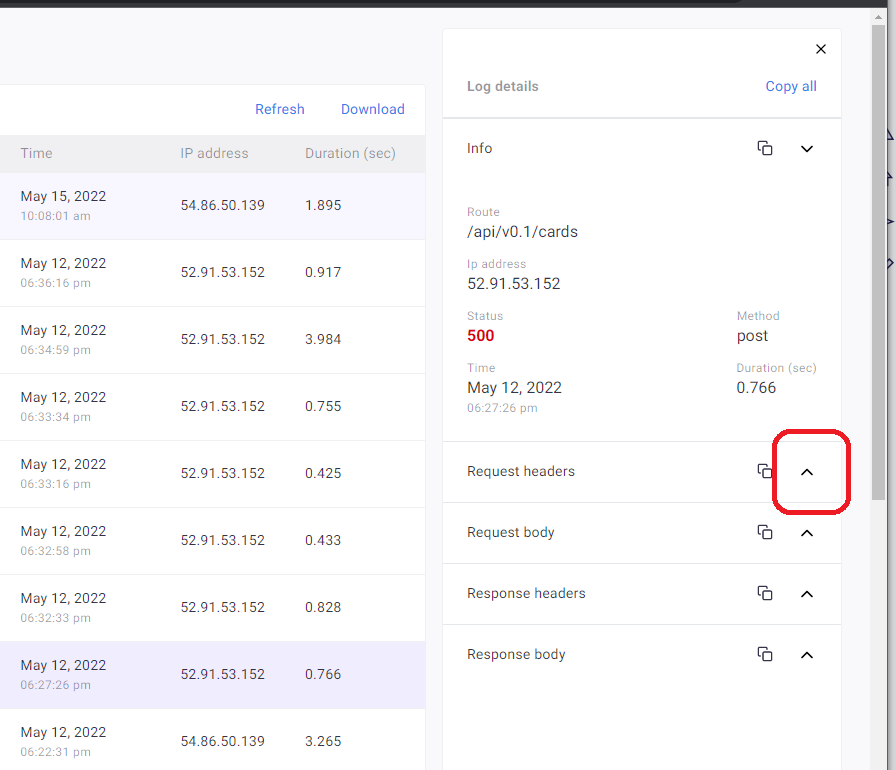
- Click on the log you want to examine.
The details pane for the log is displayed on the right.

- Click Expand (chevron) to expand the required section, for example Request headers or Request Body.
The relevant section is expanded. - Click *Copy all to copy all log details to your clipboard.
Updated almost 4 years ago
Next Steps
